
Quick Answer
A structured settlement buyout calculator estimates your lump sum by applying a discount rate (typically 9-15% in 2026) to your future payments using the present value formula. The result: how much cash a buyer would hand you today in exchange for your future payment stream.
Best Rate
9%
= most cash
Average
12%
= typical offer
Walk Away
15%+
= lowball
Free Structured Settlement Buyout Calculator
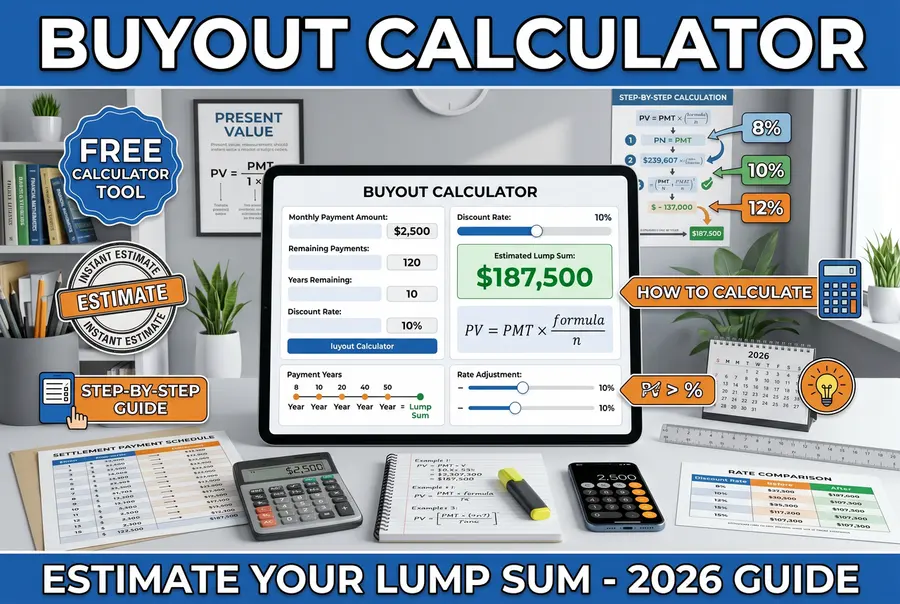
Adjust the sliders below to match your settlement. The calculator instantly shows your estimated lump sum at three different discount rates — so you know exactly what a "good" vs "bad" offer looks like for YOUR specific payments.
$2,000
15 years
11%
Total Face Value (all payments)
$360,000
180 payments × $2,000
Your Estimated Lump Sum
$175,964
at 11% discount rate (49% of face value)
Same Settlement, 3 Different Offers:
Best Offer (9%)
$197,187
55% of face value
Average Offer (12%)
$166,643
46% of face value
Low-Ball Offer (15%)
$142,899
40% of face value
🚨 The gap between best and worst: $54,288
This is why you NEVER accept the first offer.
How the Buyout Calculator Works (The Math Explained Simply)
Every structured settlement buyout uses one formula — the Present Value of an Annuity. It's the same math Wall Street uses to price bonds. The formula converts your stream of future payments into a single number: what those payments are worth in today's dollars.
Here's the formula in plain English: take each future payment, shrink it based on how far away it is (because money today is worth more than money later), then add them all up. The "shrinking factor" is the discount rate — and that single number determines whether you get a great deal or get ripped off.
The Present Value Formula
PV = PMT × [(1 - (1 + r)-n) / r]
PV = Present Value (your lump sum)
PMT = Payment amount per period
r = Periodic discount rate (annual ÷ 12 for monthly)
n = Total remaining payments
💡 You don't need to memorize this. The calculator above does the math instantly. What matters: a LOWER discount rate = MORE cash for you. A HIGHER rate = LESS cash. Even 2% difference can mean $10,000+ on a typical settlement.
7 Factors That Determine Your Discount Rate
Not all settlements get the same rate. Here's what pushes your rate lower (better for you) or higher (worse for you):
1. Payment Type
3-6% difference2. Total Amount
2-4% difference3. Timeline
1-3% difference4. Insurance Company
1-2% difference5. State Laws
0-3% difference6. Market Rates
1-3% difference7. Competition
5-15% more cash⚠️ Factor #7 is the most powerful. Getting 3-5 competing quotes forces buyers to compete on rate. This single action saves sellers an average of 8-15% more cash than accepting a single offer.
State Laws & Discount Rate Caps
Most states don't cap discount rates explicitly — they rely on judges to reject unreasonable rates. But a few states have statutory caps that protect you:
| State | Rate Cap |
|---|---|
| North Carolina | Prime + 5% (~13%) |
| New York | No SS cap (lottery: prime+10%) |
| California | No statutory cap |
| Texas | No statutory cap |
| Florida | No statutory cap |
| Pennsylvania | No statutory cap |
| Illinois | No SS cap (lottery: prime+10%) |
| Georgia | No statutory cap |
How to Use This Calculator to Negotiate Better Offers
The calculator isn't just informational — it's a negotiation weapon. Here's the exact process used by people who consistently get the best rates:
Calculate Your Three Scenarios First
Before talking to ANY buyer, run your numbers at 9%, 12%, and 15%. Write these down. Now you know: what a great offer looks like, what an average offer looks like, and what's unacceptable. Most sellers skip this step and have zero frame of reference when a buyer quotes them.
Get 3-5 Written Quotes
Contact multiple buyers and request written offers. Each must include the discount rate AND the net lump sum. If a buyer won't put the discount rate in writing, they're hiding something — walk away.
Reverse-Engineer Each Offer
Plug each buyer's lump sum offer into the calculator. Adjust the discount rate until the calculator output matches their offer. Now you know their actual rate — even if they tried to obscure it. This is your power move.
Play Buyers Against Each Other
Share that you have competing offers (you don't need to reveal exact numbers). Say: 'I have a quote at X% from another buyer — can you beat it?' Reputable buyers will either match or improve. Buyers who pressure you to stop comparing are the ones overcharging you.
Accept the Best Written Offer
Choose the buyer with the lowest discount rate AND clearest terms. Confirm the lump sum is the exact amount hitting your bank account (no hidden fees deducted at closing). Sign only after comparing all quotes side-by-side.
Your Calculator Shows $175,964 — But That's Just an Estimate
Real offers vary by $5,000-$20,000 depending on which buyers you contact. Get actual written quotes from 26+ competing buyers to see your true maximum payout.
5 Costly Mistakes Sellers Make (That the Calculator Prevents)
Accepting the first offer without knowing the market rate
The calculator shows you what a fair offer looks like BEFORE any buyer contacts you. Knowledge is leverage.
Typical cost: $8,000-$20,000Not understanding what the discount rate means in real dollars
Slide the rate from 9% to 15% and watch the dollar impact. That visceral understanding prevents you from accepting bad rates.
Typical cost: $5,000-$15,000Selling everything when a partial sale would cover their needs
The partial sale calculator shows exactly how much you'd get by selling only 24 months — preserving the rest for your future.
Typical cost: $30,000-$100,000+ in future incomeBelieving all buyers offer the same amount
The three-scenario comparison proves that the same settlement gets wildly different offers depending on who you ask.
Typical cost: $10,000-$25,000Not reverse-engineering the buyer's discount rate from their offer
Adjust the calculator rate until it matches a buyer's quoted lump sum. Now you know their actual rate — even if they tried to hide it.
Typical cost: Impossible to negotiate without thisFrequently Asked Questions
Ready to See What Real Buyers Will Pay?
The calculator gives you a strong baseline. But real offers depend on your specific insurance company, payment type, state laws, and current market conditions. The only way to know your true maximum payout is to let competing buyers bid on your specific settlement.